Native Datadog integration
Push Redis Cloud metrics directly to Datadog with the native, API-based integration, configured from the Redis Cloud console.
The native Datadog integration pushes Redis Cloud metrics directly to your Datadog account over an API. You don't need a Datadog Agent, VPC peering, or any network configuration. Redis Cloud sends account-level metrics for all subscriptions and databases in your account, and provides a prebuilt dashboard.
How the native integration works
- Redis Cloud pushes metrics to Datadog over an API, so there's no agent, VPC peering, or firewall configuration to manage.
- You configure and manage the integration entirely from the Redis Cloud console. Setup takes about two minutes.
- Metrics are account-level: they cover every subscription and database in your account, with automatic discovery of new subscriptions and databases.
- Metrics appear in Datadog within about 30 seconds of activation.
- A prebuilt dashboard is available in Datadog when you activate the integration.
- The API key you provide is encrypted at rest and used only to push metrics. Redis Cloud never reads from or modifies your Datadog account.
Native compared to agent-based
| Agent-based | Native | |
|---|---|---|
| Setup | Manual, per cluster | From the console, account-level |
| Maintenance | Ongoing (reconfigure after redeployments) | None |
| Data scope | Cluster-level/Subscription-level only | Account-level, with auto-discovery of subscriptions and databases |
| Infrastructure | A Datadog Agent per cluster | None |
The agent-based integration remains available for Essentials plans and for Pro accounts that haven't migrated yet.
Prerequisites
- An active Redis Cloud Pro subscription.
- An active Datadog account.
- Permission to create and manage Datadog API keys.
Create a Datadog API key
In Datadog, go to Organization Settings > API Keys > New Key. Copy the key — you need it during setup.
Set up the integration
- Sign in to the Redis Cloud console.
- Select Account, then open the Integrations tab.
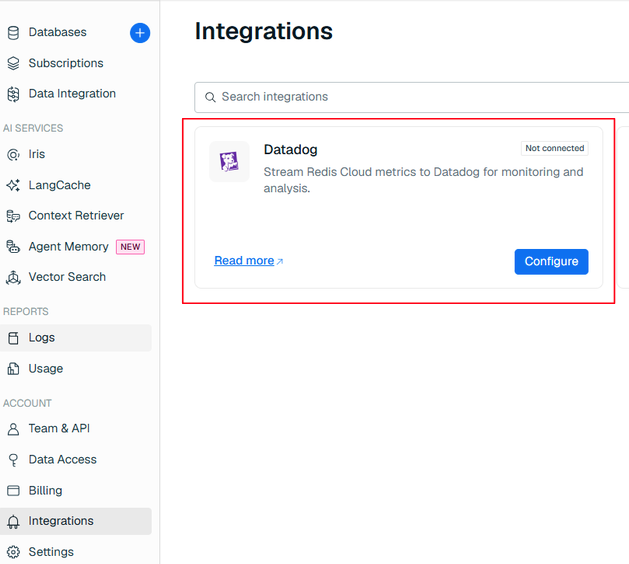
- On the Datadog card (its status is Not connected), select Configure.
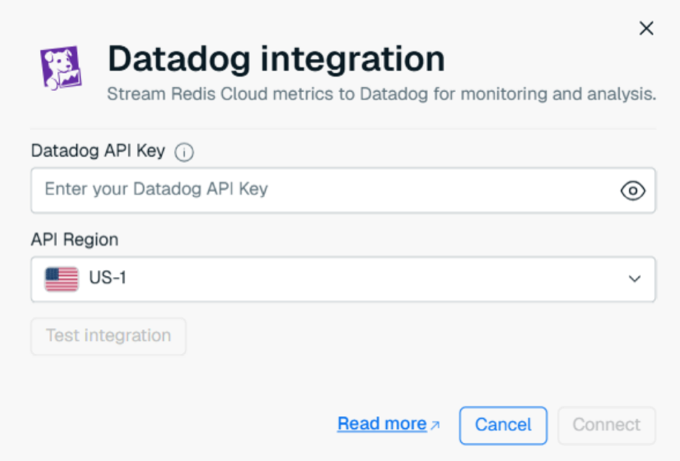
- Enter your Datadog API key and select your Datadog region, such as US-1 or EU-1.
- Select Connect.
The Datadog integration appears on the Account > Integrations page:
In the Datadog integration dialog, enter your API key, select your API region, and select Connect:
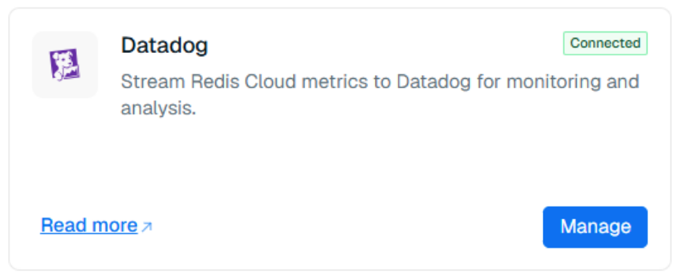
Redis Cloud validates the key and activates the integration. When validation succeeds, the Datadog card shows a green Connected badge.
Make sure the region you select matches your Datadog account:
app.datadoghq.com→ US-1app.datadoghq.eu→ EU-1
Verify the connection
The Datadog card shows a real-time status indicator:
- Connected — metrics are being pushed successfully.
- Not connected — the integration hasn't been activated.
- Connection error — a push failure was detected.
To verify the end-to-end flow, select Test connection. Redis Cloud sends a test metric and updates the status automatically.
Verify metrics in Datadog
Metrics begin appearing in Datadog within about 30 seconds. All Redis Cloud metrics use the rdse2. prefix.
To confirm that metrics are arriving:
- In Datadog, go to Metrics > Explorer.
- Search for
rdse2.db_config.
If the metric returns data, metrics are reaching Datadog. If it doesn't, see Troubleshoot.
To scope the metrics you view, use the Subscription and Database filters in the Redis Cloud dashboard.
Built-in dashboard
A prebuilt Redis Cloud dashboard is available in Datadog after you activate the integration. It covers key database metrics, including performance, memory utilization, latency, operations, connections, and cache efficiency. A link to the dashboard is available from the integration settings.
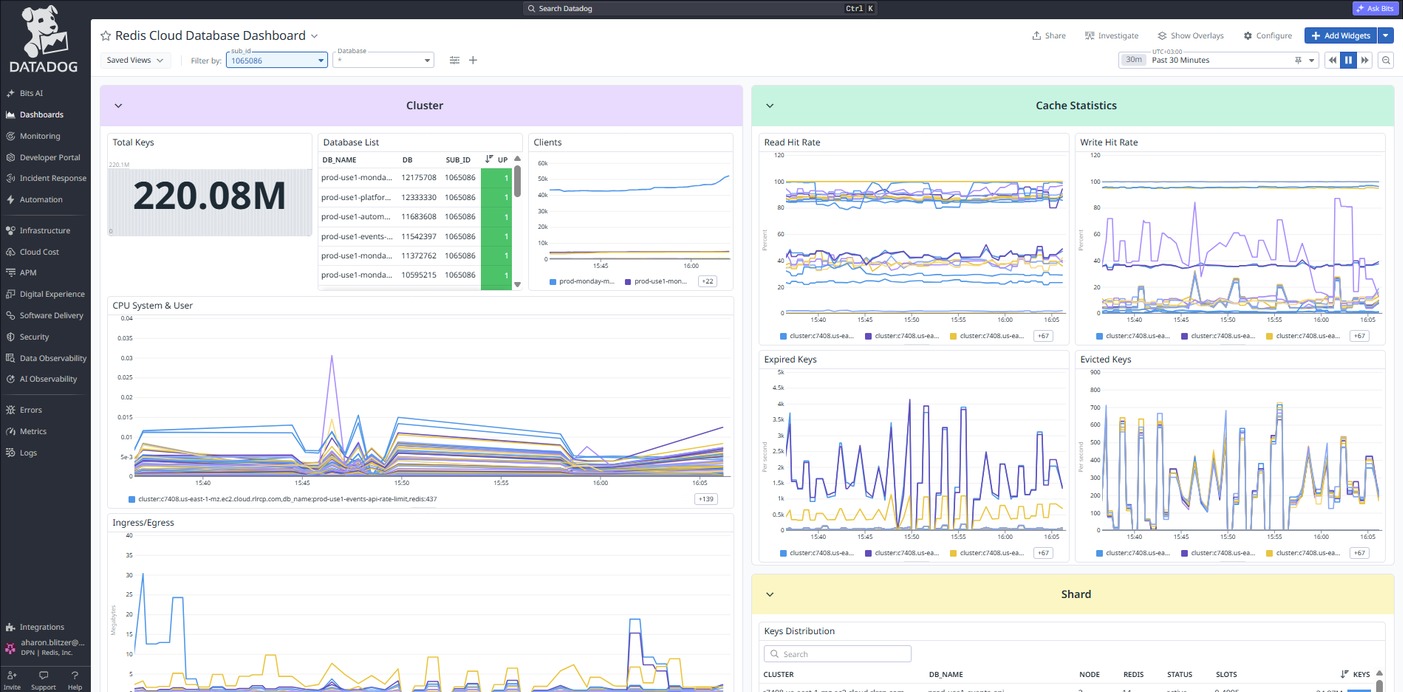
If the dashboard isn't available yet, import it manually: in Datadog, go to Dashboards > New Dashboard > Import dashboard JSON, then select the dashboard JSON file.
Metrics reference
All metrics use the rdse2. prefix. The following table lists a subset of the available metrics.
| Metric | Description |
|---|---|
rdse2.db_config |
Database availability (1 = up, 0 = down) |
rdse2.redis_server_used_memory |
Database memory usage |
rdse2.db_memory_limit_bytes |
Configured memory limit |
rdse2.redis_server_db_keys |
Number of keys in the database |
rdse2.endpoint_read_requests |
Total read commands received by the proxy endpoint |
rdse2.endpoint_write_requests |
Total write commands received by the proxy endpoint |
rdse2.endpoint_other_requests |
Total non-read/write commands received by the proxy endpoint |
rdse2.endpoint_read_requests_latency_histogram_sum |
Cumulative sum of read request latency observations (µs) |
rdse2.endpoint_read_requests_latency_histogram_count |
Cumulative count of read request latency observations |
rdse2.endpoint_write_requests_latency_histogram_sum |
Cumulative sum of write request latency observations (µs) |
rdse2.endpoint_write_requests_latency_histogram_count |
Cumulative count of write request latency observations |
rdse2.endpoint_other_requests_latency_histogram_sum |
Cumulative sum of other request latency observations (µs) |
rdse2.endpoint_other_requests_latency_histogram_count |
Cumulative count of other request latency observations |
rdse2.redis_server_connected_clients |
Number of client connections currently open to this shard |
rdse2.redis_server_keyspace_read_hits |
Cumulative successful read-command key lookups (cache hits) |
rdse2.redis_server_keyspace_read_misses |
Cumulative read-command key lookups that missed |
rdse2.redis_server_keyspace_write_hits |
Cumulative successful write-command key lookups |
rdse2.redis_server_keyspace_write_misses |
Cumulative write-command key lookups that missed |
rdse2.node_memory_MemFree_bytes |
Free memory on the host node, in bytes |
Migrate from the agent-based integration
Both the agent-based and native integrations can run in parallel. You can enable the native push integration without downtime, then disable the legacy agent afterward.
To avoid a gap in observability, complete the migration and verify that metrics are arriving in Datadog before you disable the Datadog Agent. Data collected by the legacy agent remains available in its existing dashboard.
Manage the integration
- Sign in to the Redis Cloud console.
- Select Account, open the Integrations tab, and select Manage on the Datadog card.
From there, you can:
- Test the connection.
- Disable the integration.
To replace the API key or change the Datadog region, disable the integration, then set it up again with the new key or region.
Troubleshoot
The connection test fails
- Verify that the Datadog API key is correct.
- Make sure the Datadog region you selected matches your account.
- Confirm that the API key is active and has the required permissions.
No metrics appear after a few minutes
- Confirm that the integration status is Connected in the Redis Cloud console.
- In Datadog, go to Metrics > Explorer and search for
rdse2.db_config. If the metric exists, data is reaching Datadog. If not, recheck the integration configuration and API key.